Building in public
2 minute read
An even more accurate Stability Score
Article summary
• Get a more accurate daily snapshot of how your body is doing, with an updated Stability Score and redesigned Stability page.
• The new algorithm focuses on meaningful changes in your signals rather than small fluctuations.
• Your scores may look different at first, so keep using them alongside how you feel.
• Tap the heart rate, HRV, sleep or symptom cards to see the past seven days against your normal range.
• Update to the latest version of the Visible app to start using it.
Your Stability Score gives you a daily snapshot of how your body is doing, helping you decide how to pace your day. Now, we’ve made some adjustments to make it more accurate.
We’ve improved how your score handles smaller day-to-day fluctuations, and redesigned the Stability page to give you more context at a glance.
Better insight for your day
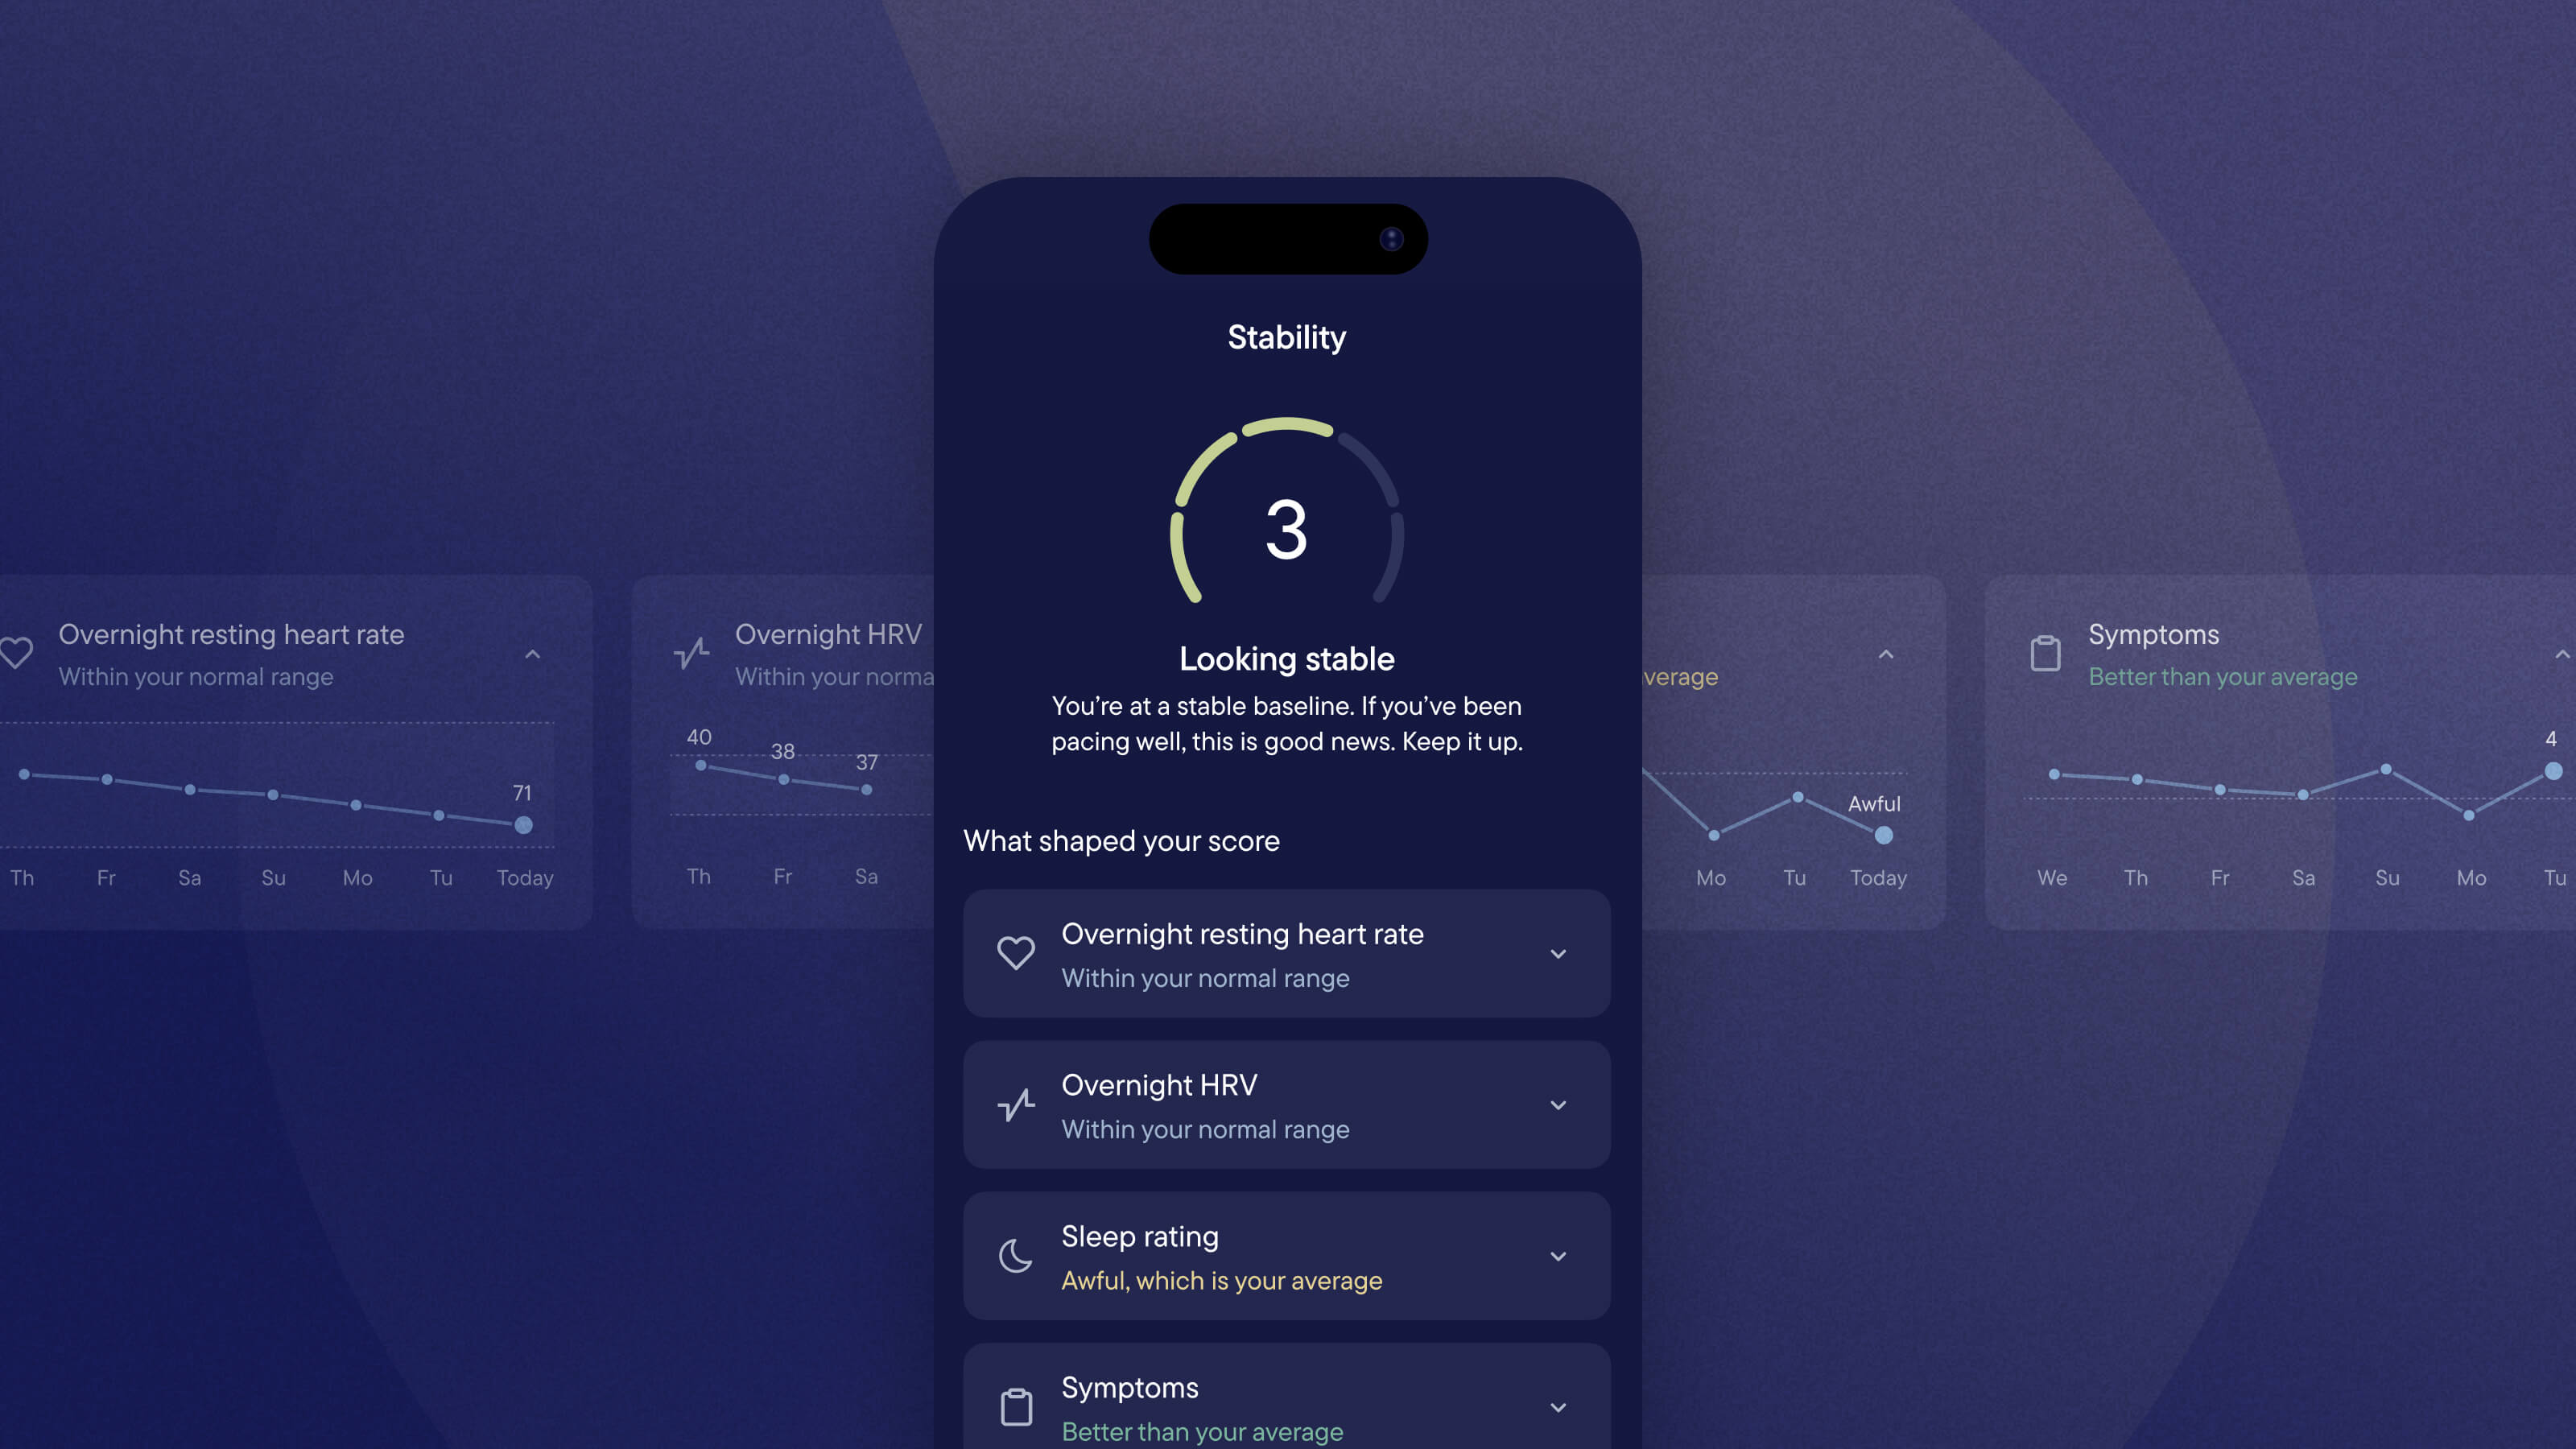
Your Stability Score brings together your resting heart rate and heart rate variability (HRV) plus your self-reported ratings for sleep and symptoms. It gives you a score from 1 to 5 showing how steady your signals are.
The updated algorithm is better at picking up meaningful changes in your body’s signals, without being disproportionately affected by smaller fluctuations. These new scores should be more accurate in terms of how recovered or resilient your body is, giving you more useful insight to guide how you pace your day.
Your score might look different at first
With this update, you may notice some differences in your scores. For example, a day that previously gave you a 4 might now give you a 3. These differences may take a little bit of time to get used to, but you should find that the score is a more accurate aid for pacing. As always, use your Stability Score alongside how you feel and what you know about your body.
Your recent signals at a glance
The redesigned Stability page gives you a view of how your signals have been changing recently.
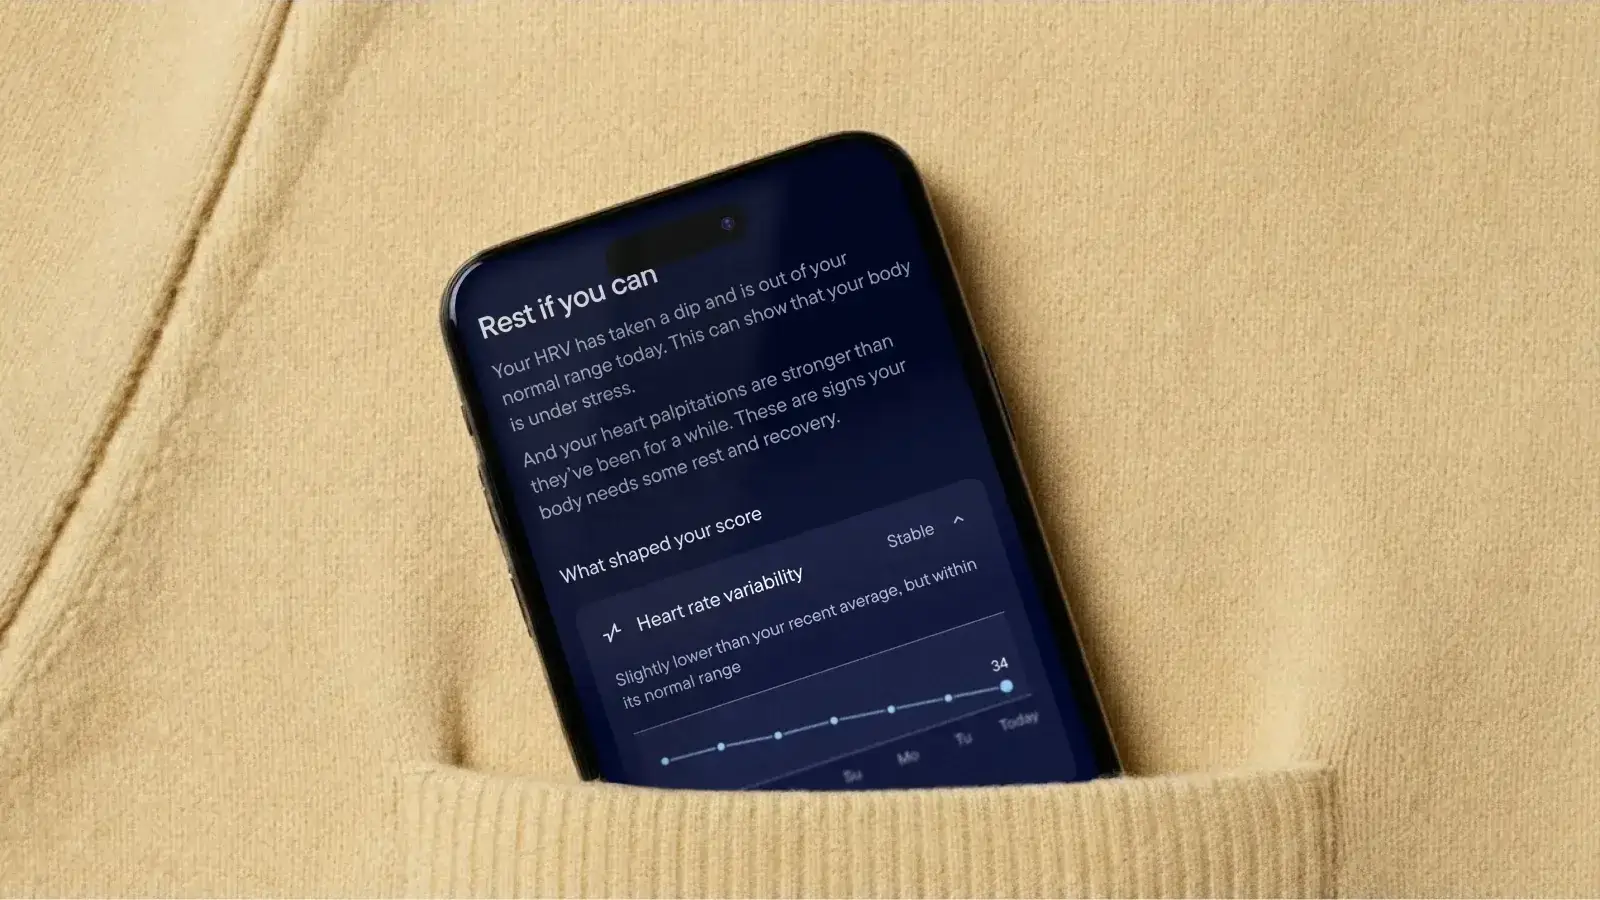
Tap the resting heart rate, HRV, sleep or symptoms cards to expand them and see your data from the past seven days, alongside your normal range. Your normal range is based on up to 90 days of your previous data. Your score is calculated by comparing today’s signals with this range.
If you’re newer to Visible, your normal range uses the data you have so far and gets to know what’s normal for you over time. The more you use Visible, the more accurate it becomes.
Available now
Update to the latest version of the Visible app to start using the updated Stability Score and explore the new Stability page.
For more information about your Stability Score:
Related articles